Carl Cannon Holistic Digital Marketing Strategy with Dealer.com

Colby LeFevre, Dealer.com’s Senior OEM Product Manager, walks through the keys to personalization on dealer websites. In this webinar, recorded Wednesday, September 13, 2018, LeFevre demos our all new Specials Campaign Manager and our award-winning personalization technology, Experience Optimization. For more details about either of these products, please contact your Digital Strategist or Dealer.com Sales Rep.
The increasing availability of consumer shopping data has made it possible for dealers to deliver personalized website experiences, with exciting results. Dealer.com studied its industry-leading network of dealership websites to examine the impact of personalization technology on performance and user experience.
With just a few clicks, this free feature automatically creates and deploys specials to slideshows, listings pages, and coupon pages!
While this news isn’t a shock to the industry or most digital solution providers (Google started talking about it years ago) the announcement provides a go-live timeframe, which will allow your dealership to prepare and ensure your mobile site remains fully optimized after the algorithm update.
Accordingly, here’s what you need to know now:
Interestingly, this update isn’t purely about speed. While it’s natural to assume that the faster your site is, the higher it will rank, that’s NOT necessarily the case yet. In truth this update will only negatively impact the mobile SERP visibility for sites that deliver the slowest experience to users.
From Google: “The “Speed Update,” as we’re calling it, will only affect pages that deliver the slowest experience to users and will only affect a small percentage of queries. It applies the same standard to all pages, regardless of the technology used to build the page. The intent of the search query is still a very strong signal, so a slow page may still rank highly if it has great, relevant content.”
There are a couple statements in that paragraph that are worth noting.
Like any solution provider, Dealer.com will be watching the algorithm update closely and monitoring SERP visibility for our website and SEO clients. Based on the details that Google has provided to date, we do not expect our clients to see any impact.
If you are interested in seeing how Google views your mobile page load times, you can test your site with their Pagespeed Insights Tool. It was recently updated to include data from the Chrome User Experience report. Look forward to an upcoming post discussing this new data set.
As mobile continues to dominate the digital experience, the more informed you are, the better off you will be. Feel free to comment below with your thoughts!
*For more information about Google’s Mobile First Index, please see What Google’s New Mobile-First Indexing Means for Your Dealership Website.
—Pete Bruhn
One size doesn’t fit all when it comes to the vehicles people drive so why should your dealership website experience be that way?
We’re in the age of the consumer; today’s shoppers expect more from their website experience than ever before. They don’t just want to see the same rotating promotional slides, or new vehicles on your lot; they want to see what you can offer them as individuals. Essentially, they demand a personalized experience. All of today’s leading consumer sites leverage this powerful technology, and it’s time for the auto industry to catch up.
So how does this apply to vehicle shopping? Let’s say you have a shopper, Caroline, on your website who looked at a Nissan Altima one morning. She continues her research on Kelley Blue Book, and while there, ends up reading reviews and views recent awards bestowed upon the Nissan Rogue. Caroline puts down her phone and heads out to lunch or her next meeting. Later in the evening, she picks up her search again by returning to your dealership website on her laptop. This is the moment when you should deliver a personalized shopping experience, one that remembers where Caroline left off, and displays relevant inventory and incentives information to her.
1. Recommend relevant vehicles in your inventory based on what shoppers were interested in. Let technology ensure you match the right car to the right person, rather than leaving it all to chance.
2. Use technology to automatically render personalized promotional assets. Shoppers only look at the first few slides on your website, or may deep link to a filtered listing page. Ensure you are showing specials that are highly tailored to their interests, like, for example, a lease incentive on that Rogue. Get the right deals in front of the right shoppers to increase the likelihood of purchase.
3. Recommend next steps or varying calls to action based on what we know about shoppers. For example, did they look at a lease incentive before? On the vehicle details page, prompt them to calculate a lease payment. Or, have shoppers already calculated payments and a trade-in? Suggest they fill out a finance application. Take the guess work out of the process and help guide your shoppers towards the sale.
Personalizing your consumers’ digital experience does more than just steer buyers to the vehicles and content in which they are most interested; it produces big results. Experience Optimization generally results in click through rates two to two and a half times higher on personalized content than on non-personalized content.1
It’s time to make your website a customized virtual showroom to provide an individually-tailored experience to every one of your shoppers. It’s time to make digital car shopping personal.
Katie Wilkins is the director of product management at Dealer.com
1 Dealer.com Homepage Personalization Test, August 2017
We all know from experience how important website speeds are, especially when using a mobile device over a mobile network. As technology advances, the importance of delivering a convenient and streamlined experience, facilitated through reliable and quick-loading webpages, is more crucial than ever.
There are tools out there, like Google PageSpeed Insights, which can test and grade the performance of your website. While they can be helpful, they don’t always paint a true picture of how a website performs, either from a load speed perspective, or from a user experience point of view.
Because there’s been a recent influx of questions related to site speeds, particularly as they relate to Google’s PageSpeed Insights tool, let’s spend a few minutes discussing what these tests mean and how to speak to their results.
A website that scores a 100/100 on mobile or desktop speeds using the test on Google PageSpeed Insights doesn’t necessarily mean that the user experience is amazing or that the website performs any better than a site that gets, say, a 75/100. In fact – and this might come as a surprise to some of you – Google PageSpeed Insights scores aren’t truly accurate because they don’t, and can’t, grade a user’s true site experience. Let’s elaborate.
First of all, PageSpeed Insights results are just a subjective score based on general criteria that Google recommends to the average website/webmaster. It’s not the authority of website speed analysis. While it’s a great reference guide, it doesn’t account for user experience as it relates to a website’s loading time. Some things that are slow in automated tests may not be impacting actual user experience (like background events that the user never sees).
Site speed tests such as Google PageSpeed Insights do not account for server-side processing, and instead just examine network latency. In short, they don’t analyze the true experience a user has while loading websites. In addition, the grading systems used by these sites don’t consider optimizations that improve the total download time at the expense of the first byte time, nor do they include the amount of offline caching that occurs, which increases user experience and speed upon page load.
Automated performance evaluations are general tools for use across a broad array of websites. As such, they focus on easily measurable, quantifiable metrics. While the outcomes of these tests are important to address, they’re probably not the best data points to use to inform a path toward website optimization.
If a Dealer.com website is loading slowly, the majority of the time it’s due to third-party content/integrations, custom CSS, and/or JavaScript. When using Google PageSpeed Insights, test the domain using “?_mode=reset” as a parameter on the URL. Adding “?_mode=reset” to the domain strips out all custom CSS, JavaScript, and third-party content. The typical results show a significant increase when testing with this method.
Below is a real example of a Dealer.com dealer website that shows the increase in performance when the third-party content/tools and the custom CSS and JS is stripped out:
Results without ?_mode=reset:
Mobile – 58/100
Desktop – 75/100
Results with ?_mode=reset:
Mobile – 70/100
Desktop – 84/100
Poor page speed scores aren’t just a problem for auto dealer websites, however. Take a look at how Google PageSpeed Insights scores two of the world’s most popular websites:
As is usually the case with a variety of Google tools that test a website’s digital performance, this site isn’t considering all of the factors that go into an optimal user experience. As such, Google PageSpeed Insights tests are causing misperception across industries. But, what Google PageSpeed Insights do accomplish is to shed light on the importance of weighing the value of third-party content/tools and custom CSS/JS. There is always a trade-off between incorporating those features and the speed of your website.
Have questions or concerns about site speeds and loading times? Connect with me by using the comments field below.
Pete Bruhn is the product manager – website platform at Dealer.com
At this year’s SMX Advanced in Seattle I asked Google’s Gary Illyes if “hiding” content behind a Read More button affects websites’ SEO.
His answer wasn’t surprising considering Google’s stance on user experience. This practice, which essentially directs users to click a button/link that says Read More or Read On to view the full content, does have an effect on sites’ SEO, including auto retailers using Dealer.com Websites. Specifically, Google does not index content hidden behind these buttons on desktop sites.
This is an important distinction. Since Google currently uses the desktop version of a website as the primary source of content for its index, it impacts a site’s visibility in search results. Until Google launches its new Mobile First Index (sometime in 2018), Dealer.com recommends that dealers refrain from hiding any content on the desktop version of their websites.
Compared to mobile, desktop screens have real estate to spare. There’s no reason to save space by hiding content behind click for more buttons. If anything, it can seem a little deceptive, and doing so just puts websites at an SEO disadvantage since Google won’t use this hidden content to evaluate quality, no matter how relevant it is to the end user.
On the other hand, Read More buttons on mobile are completely acceptable since it actually makes the user experience better, according to Illyes. Just remember that Google isn’t yet indexing mobile devices first.
Here are my recommendations regarding this issue with Google’s current desktop indexing:
Comments? Questions? Reach me by commenting below. Thanks!
Pete Bruhn is the product manager – website platform at Dealer.com
*OEM restrictions may prevent you from doing this.
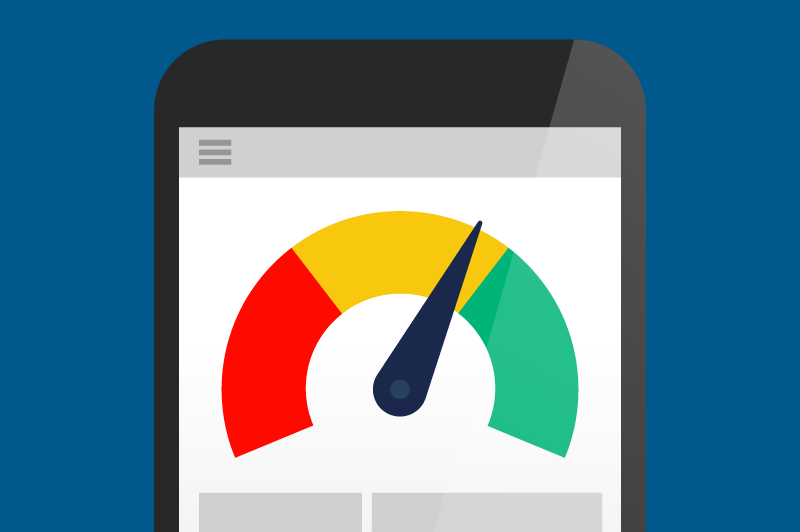
You may have noticed more industry buzz surrounding mobile website loading speeds. For this, we can thank Google and its update to the “Test My Site – Think With Google” tool.
Test My Site – Think With Google now shows mobile webpage loading results in seconds at 3G connection speeds, as well as estimated traffic loss, and industry comparison.
But how accurate are these results, and how much faith in this resource should auto dealers, looking to deliver an optimal digital experience, have in it? Let’s take a few minutes to examine Google’s site load speed tool and the accuracy of its results, as well as an alternative method to test page loading speeds to see what actual users would experience.
First of all, Test My Site – Think With Google tells you how many seconds it takes to load a web page over 3G connection. To do this it uses webpagetest.org as the source of this data, which connects to 3G at 1.6 Mbps. From Google’s perspective this makes sense because it operates at a global scale. Google claims that over 70 percent of the world will connect to the internet via 3G connection speeds or lower through 2020.
For dealers using Dealer.com Websites and for potential customers shopping for cars on those same websites, however, Google’s results are inaccurate because connection speeds are much higher in North America where most Dealer.com Websites are located.
According to Akamai, the average mobile connection speed in the United States is 10.7 Mbps. The Ookla Speedtest has the average mobile connection speeds even higher – much higher – at 19.6 Mbps. What’s more, OpenSignal’s “The State of LTE” report shows that 81 percent of US residents have access to 4G connections (as of Nov. 2016). Many analysts believe that number to be closer to 90 percent today.
What this means is that the vast majority of mobile users in the US access websites with a connection that is more than triple – in some cases even more than septuple – the speed with which Google tests. Test My Site – Think With Google’s test results are NOT the same as what the average mobile user in the US experiences.
So, if Google’s results aren’t leveraging the most common connection speeds in US, is there a way to test for accurate mobile load times for Dealer.com Websites? Yes. And, oddly enough, it’s through another Google resource: Chrome Developer Tools.
Here’s a step-by-step which outlines exactly how to find accurate mobile website connection speeds:
1. Open Google Chrome.
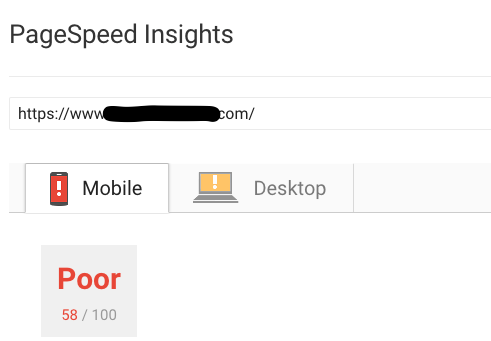
2. Open the website you’d like to test (in this example, I’ll use https://www.almartinvolvocars.com/).
3. Right-click anywhere on the page and then select “Inspect” at the bottom of the drop-down menu to open Developer Tools. (Get ready for code, and don’t freak out. You didn’t break anything.)
4. Select the “Network” tab.
5. Click the mobile emulator icon.
6. Click “Capture Screenshots” icon.
7. Click “No throttling” and select “Add” under “Custom” in the drop-down menu.
8. Click “Add custom profile…”.
9. Add a custom profile name and then input the following values, which reflect average mobile connection speeds in the US:
– Download – 10700 kb/s
– Upload – 5000 kb/s
– Latency – 5 ms
10. Click “Add” to save the custom profile.
11. Click the “X” to close the Network Throttling Profile settings.
12. Click “No throttling” then select your custom profile.
13. For PC users, click your browser’s refresh button to reload the site as mobile and to generate the screenshots of the page load. For Mac users, hit Command ⌘ + R to reload the site and capture the filmstrip.
14. Once the page has reloaded, explore the screenshots at the top of the Inspect window to see actual load time results. Be sure to click through them to find the screenshot that shows the page fully loaded (the image to the far right), then note the time it took to load.
In this example, the mobile version of this page loaded in 1.08 seconds. Test My Site – Think With Google reports a four second load time. That’s just about a three second discrepancy – a huge difference considering estimated visitor loss due to loading time. Note: each load time test may differ slightly when using Chrome Developer Tools. After a second attempt, for example, the same website’s load time was .972 seconds.
The point is that while tools like Google’s Test My Site benefit users with their ease of use and in-the-ballpark estimations, they’re far from accurate. Before you put all of your trust in these testing tools, give the method laid out above a try on a Dealer.com Website, or any other website, to see precise mobile load times before jumping to any conclusion.
For clarification on any of the steps outlined above, or if you’d like to share your test experience, please comment below. Thanks!
Pete Bruhn is the product manager – website platform at Dealer.com
Click for ePrice.
Show discounts, rebates, and MSRP.
Present only your asking price.
Display all of the pricing: MSRP, discounts, and add-ons.
Don’t show any pricing and just include a “call to inquire” button.
The combinations for displaying your inventory’s prices seem practically endless. And rightly so. Inventory pricing, and how your website displays it to the shopping public, is an important part of your sales strategy.
Depending on what you would like your shoppers to do next, you’re faced with multiple decisions. Are you displaying all of the pricing information – discounts, rebates, and add-ons, to name a few – in an attempt to build trust with and empower your shoppers? Or is your goal to gather consumer information so that your sales team can close the deal once shoppers are convinced to come in to the showroom? Or, does your strategy fall somewhere in between?
Whichever your strategy, your website should have the flexibility to accommodate any pricing equation – and give you the control to make changes yourself – to effectively advertise inventory to your shoppers.
In the past, website providers have offered only narrow pricing display options and very limited control, given the complexities of dealer-by-dealer marketing strategies and states’ various sales compliance rules. But as these rules have evolved, it’s become clear that limited pricing display parameters restrict dealerships because they diminish the multiple pricing combinations that dealers would otherwise use to their benefit.
With more inventory pricing display options and autonomy, dealers are empowered to show more of the price/cost breakdown to shoppers. Here are just a few combinations which become possible with flexible inventory pricing displays:
1. A-B+C = D – Show a discount first and then an ‘add-on’ value:
Example:
MSRP: $32,000
Discount of – $1,000
Retail Value: $31,000
Add On of $3,000
Internet Price: $34,000
2. A-B-C = D – Show two potential discounts fields or combine two discounts:
Example:
MSRP: $32,000
Discount – $1,000
Retail Value: $31,000
Discount – $2,000
Internet Price: $29,000
3. A+B-C = D – Show an add-on and a discount field; showing middle price is optional:
Example:
MSRP: $32,000
Add On + $3,000
Retail Value: $35,000
Discount – $1,000
Internet Price: $34,000
4. A+B+C = D – Show the sum of all options:
Example:
MSRP: $32,000
Add On + $1,000
Retail Value: $33,000
Add On + $2,000
Internet Price: $35,000
Your pricing strategy is your business. Giving you the flexibility and control to display your inventory pricing should be the job of any website provider.
Comment below to share how inventory pricing display flexibility might make significant changes to your sales strategy. As always, we are happy to connect for a strategic consultation.