Car Shopping Tells Us a Lot About Natural Disaster Impacts on the Local Economy

Dealer.com Natural Disasters

In the wake of three of the most devastating hurricanes our country has endured, the Dealer.com team wanted to take a look at the link between these events and car shopping behavior. It turns out that car shopping can tell us a lot about how a local economy is reacting and responding to these tragedies.


First, we looked at the Houston area immediately following the landfall of Hurricane Harvey on August 26.* In the days following the hurricane, we saw a significant drop in both traffic to our websites as well as leads submitted to dealerships. That drop, however, was immediately followed by a spike as people bought new cars to replace those that were damaged in the storm. About a month later, things returned to normal levels.


Dealer.com Houston Leads


The situation in Florida following the landfall of Hurricane Irma on September 11 is similar, but slightly different in an important way. In Florida we saw a steady drop in web traffic and lead volume leading up to the hurricane’s landfall and a subsequent return to normal levels about five days later. What we didn’t see was the same spike of demand, which suggests that the damage in Florida was a bit less severe.


Dealer.com Florida Leads


In Puerto Rico, the data tells a completely different story. Hurricane Irma hit Puerto Rico on September 6, followed by Hurricane Maria’s ravaging of the island starting on September 20. The recovery of web traffic in Puerto Rico was considerably slower than in both Florida and Texas following Irma, with things starting to return to normal nine days later, only to fall again sharply as preparations for Maria began.


The devastation following Maria is clear. After three weeks, web traffic was still only 17 percent of normal, with no spike in leads. It’s not at all surprising that shopping for a car isn’t top of mind for the citizens of Puerto Rico, but the data does further emphasize the point that these hurricanes have substantially damaged the homes, property and economy of the island.


Dealer.com Puerto Rico Leads


Here’s the real takeaway from these numbers. The impact that our industry has on the hearts, minds, wellbeing and economic security of people all over the world is profound. Which is yet another reason I’m proud to be part of a company and an industry who understands this and will continue to be on the front lines of restoring normalcy and security to the areas hit hardest by these disasters.


Cox Automotive has numerous relief efforts in place to assist our dealer clients and partners impacted by these disasters. If you’re dealership or related business was impacted by the hurricanes, please contact the Cox Automotive Client Event Management (CEM) team at HurricaneSupport@coxautoinc.com.


I’m also going to make a donation to support recovery in Puerto Rico.


James Grace is the senior director of Analytics products – Autotrader, Kelley Blue Book, and Dealer.com


*The data in this article is based on visits to Dealer.com hosted websites. 


What Happens When Display Advertising Gets Even Smarter

It’s not that Dealer.com Display Advertising was lacking intelligence. It’s just that now Display has grown even smarter.

Let us explain.

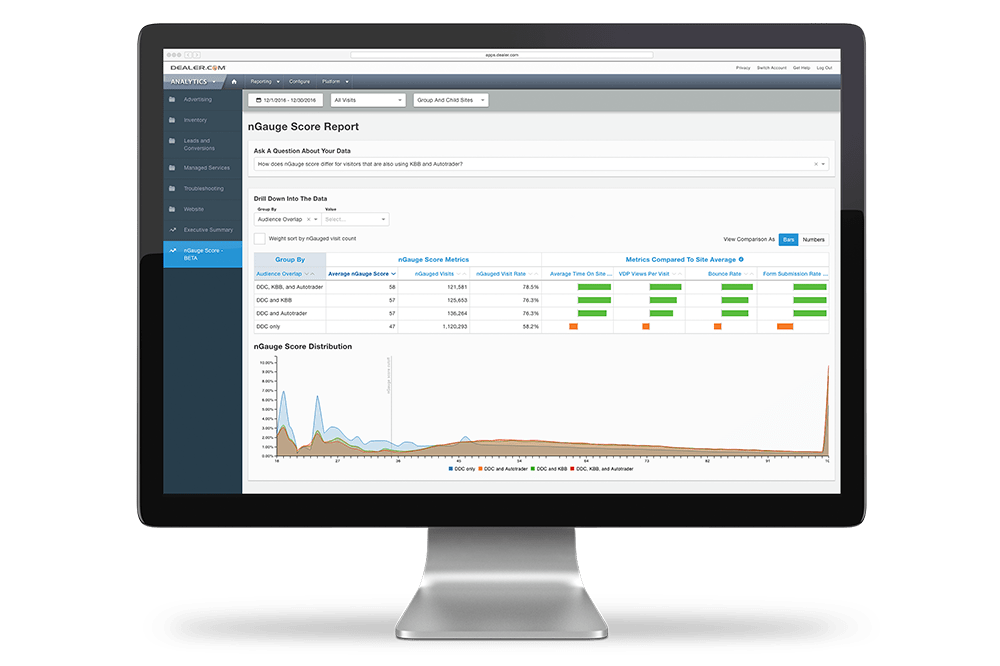
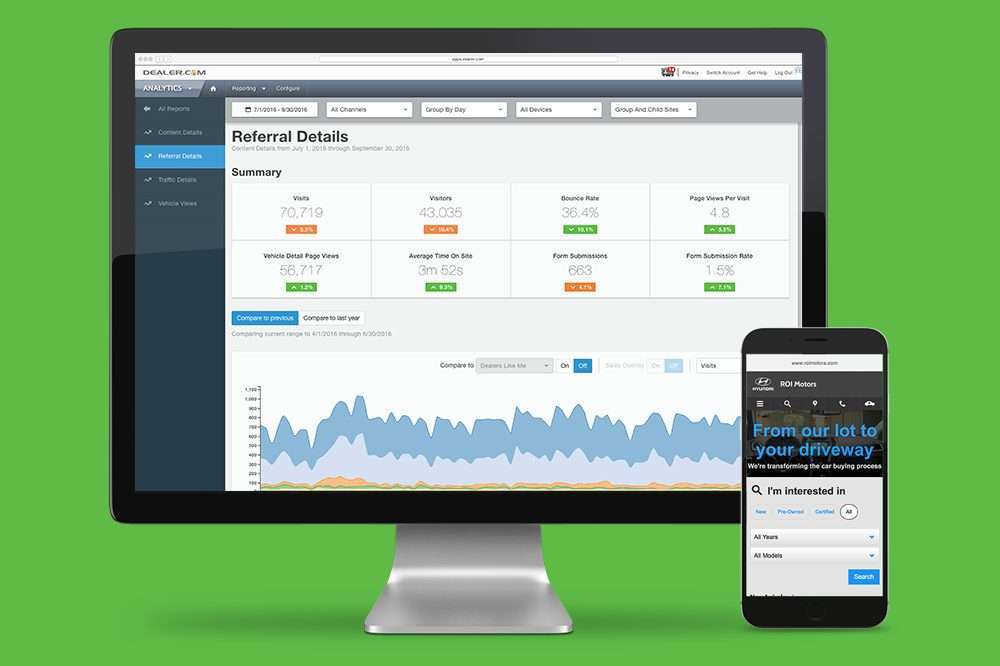
In early 2017, we launched nGauge, a Dealer.com Analytics product that examines various shopper engagement behaviors with a Dealer.com Website and assigns a quality score to each website visit. The higher the website visit “score”, the more likely it is to result in a vehicle purchase. This provides dealers with the necessary data to make a more informed sales investment, targeting shoppers more likely to buy a vehicle, and adjusting marketing goals to align with shopping intent.

So far, dealers’ response to nGauge has been very positive. In fact, many dealerships have been asking if this technology is available in any of our other products.

*Cue lightbulb turning on.

In continuing our pursuit to deliver the highest quality (not quantity) shoppers to our clients, we asked ourselves: What would happen if we used nGauge quality score technology to inform the machine learning algorithm that powers Dealer.com Display Advertising?

How Our Display Advertising Targeting Had Worked

To make sense of what we discovered, let’s review the inner workings of Dealer.com Display:

Comprising network, remarketing, and audience targeting, Dealer.com Display uses proprietary real-time bidding (RTB) powered by a form of artificial intelligence called machine learning. Simply put, this involves teaching computers to learn in a similar manner as humans do: analyze data, store it, and learn from its successes and failures.

In the advertising world, this translates to consuming information about an impression, examining the outcome, and then realizing either a success or failure. If deemed successful, the algorithm treats the impression (and its unique characteristics) as a positive signal, which is then used to drive performance.

Dealer.com Display, which purchases impressions on behalf of our dealer partners, integrates with numerous advertising exchanges that act as the technology platform responsible for facilitating the “handshake” between advertising buyers and sellers. These ad exchanges are suppliers of inventory, where publishers (websites) generate revenue by permitting impressions (ads) housed in those exchanges on their properties. It’s an enormous digital advertising ecosystem, communicating, transacting, and serving ads in 800 milliseconds, millions of times a day. (For a neat visual representation of the programmatic advertising ecosystem, click here.)

Dealer.com’s real-time bidding receives hundreds of thousands of display advertising requests every second from ad exchanges. The system needs to evaluate each of these requests to determine if it wants to bid at the auction and at what price. For this, Dealer.com machine learning decides what it wants to buy, and at what price, for each live display campaign in our system. Using a proprietary algorithm, each display campaign operates within its own model, and draws from data to assess multiple variables like dealership characteristics, geography, ad placement, and information about the end user, to name a few.

Although each campaign – and automotive advertising agency – has its own unique model, the primary goal of the algorithm is to optimize for clicks back to a website, thus using any impression that resulted in a click as a positive learning experience for the algorithm, no matter what had happened after the click.

How Our Display Advertising Works Now

In spring 2017, and using nGauge’s quality score framework, we experimented with a change to our machine learning algorithm so that it used only quality clicks (clicks from shoppers more likely to purchase) as positive training examples. We hypothesized that this would train display ad campaigns on the traits of shoppers who are most likely to buy a car, and thus make a stronger case to pay a little bit more for impressions that are likely to lead to a quality visit.

To prove or disprove this hypothesis, we took a handful of campaigns (the experimental group) and had them “train” on the new model. We then compared our results to a different set of campaigns that had not changed (the control group).

The Results

This test showed that experimental campaigns had significantly (statistically speaking) higher quality scores than control campaigns.

Overall, we concluded that training our machine learning algorithms on quality clicks resulted in at least a three percent increase in average campaign quality score. The rate at which display advertising campaign clicks resulted in a website visit also increased by 13 percent* (as opposed to immediately bouncing after clicking the ad). This might not seem like a big lift, but when this is applied to all of our display advertising partners, it can result in a significant improvement in ROI and advertising efficiency.

As a result of this experiment, the Dealer.com Advertising engineering teams will officially change our display advertising algorithm to impact all campaigns in Q3 2017.

Analytics are growing ever more sophisticated. As nGauge demonstrates, the industry should no longer consider them an accessory, but instead make them the backbone of every digital marketing effort. Our dealers were first privy to this data in the form of quality website visits. As of this summer, they’ll be able to take advantage of a more effective advertising strategy with Dealer.com Display, which is now using quality traffic signals as a key variable when deciding how to purchase ad impressions.

Display just got a whole lot smarter.

If you have any questions or want any further detail, please feel free to reach out to comment below.

Brent Towne is the senior manager, product management – analytics, and Scott Blodgett is the product manager – advertising at Dealer.com

*There are a few factors at play here, including better avoidance of bidding on bot traffic and accidental clicks, to name a few. For more information on advertising fraud, click here.

Mining for Quality: How to Refine Your Marketing Efforts Using Attribution

Quality over quantity. Substance over matter. However you want to think about it, it’s a concept that applies to just about every facet of our lives. Automotive retail is no exception.

Car dealerships have always tried to attract quality shoppers to their showrooms, i.e. customers that are serious about purchasing a car. It’s what every retail business strives to do. Until very recently, however, there just hasn’t been a credible way to tell with a great deal of authority if a shopper is serious or not about purchasing a car from a particular dealership.

But all of that is quickly changing as valuation tools that measure the ‘quality’ of shoppers become available. And just in time, too. As the automotive market begins to soften from years of record-breaking sales numbers, the ability to measure ROI to optimize advertising and marketing spend isn’t just nice to have, it’s critical to car dealerships’ profitability.

Getting to Know Attribution

The word that digital marketers are attaching to this concept is attribution – using data to decipher and predict shoppers’ purchasing intent and how to use that information to maximize ROI.  The biggest player in the attribution space is Google, that recently launched “Google Attribution” at this year’s Marketing Next conference. It’s a tool that examines the role different marketing strategies play in consumer purchasing decisions. It’s a great way for digital retailers, in general, to dial in their marketing to achieve maximum results.

But in general is something the automotive retail industry certainly is not. Don’t get me wrong – any service that connects advertising, online data, and conversation together to make it easier for businesses to better identify how to predict consumer purchasing decisions deserves to be applauded. But auto retail is very specific and, as such, needs a solution that caters to its particular needs and parameters as part of a complete attribution strategy.

Why Google Attribution Can’t Be the Only Solution

It’s not that it’s wrong; it’s just that Google Attribution isn’t completely right for our industry, at least, not as a dealer’s sole attribution tool. There are two important reasons for this: first, Google can’t account for car transactions that happen offline, which means there’s no way to track a shopper’s entire online to in-store shopping journey; second, Google Attribution primarily works within the Google ecosystem. Unless a dealership uses AdWords or Google ad products exclusively, it’s probably best not to have the search engine, which is geared toward e-commerce (something auto retail is certainly not) as the sole source of attribution data.

So, what is a dealer looking to identify the highest quality shoppers to do? Here are two key tips to help you start separating the wheat from the chaff:

1. Optimize Digital Spend

Many dealers still spend dollars on non-effective paid search campaigns such as behavioral targeting or remarketing ads. Instead, dealers should be looking for ways to analyze their cost-per-engagement, that will ultimately yield a better ROI. This is something Dealer.com and Cox Automotive have been honing in on with the nGauge by Pixall™ tool that scores quality users’ engagement.

2. Cast a Wider Attribution Net

Most importantly, dealers should strive to leverage a “multi-touch attribution” model. It’s a strategy that tracks a series of digital touchpoints as shoppers’ work their way toward a purchase and assigns the touchpoints a value. This lets dealers see what campaigns are resonating most with their customers and allows them to adjust accordingly.

Dealership competition is fierce and budgets are tight these days, which means targeting high quality shoppers accurately and efficiently is more important than ever. Using both an attribution tool that is geared specifically toward the auto retail industry alongside Google’s vast data accessible through its own Attribution tool will give dealers the coverage they’ll need to identify the highest quality shoppers.

James Grace is the senior director product management and analytics at Cox Automotive

How 2016’s Web Traffic Data Highlights the Importance of High Quality Digital Shoppers

If there’s one thing 2016 taught us, at least in terms of automotive digital shopping data, it’s that quality, not quantity, car shopper traffic is everything.

We pulled data from across the Dealer.com dealer network to analyze website traffic amounts by day, month, and time of day in 2016. The results were not necessarily surprising and seem consistent with digital traffic trends of years past. The data does suggest that dealers must provide an engaging and efficient digital car-buying experience. More on that in a minute.

Here’s what we found:

– The busiest day of the year, in terms of shopper visits to dealer websites, was Sunday, July 24, which may be an anomaly because it doesn’t follow the usual weekly cycle of traffic ebbs and flows we’ve come to expect. The next three busiest days were Friday, August 26, Monday, August 29, and Thursday, August 25. You’ll notice these three days all closely preceded Labor Day, which typically involves heavily-promoted OEM sales events, and marks the beginning of new model year sell-down season.

– The slowest day of the year was Sunday, May 8, Mother’s Day. Nine of the 10 slowest days were Sundays. The least trafficked non-Sunday was Friday, January 1, most likely explained by people needing to recuperate physically and financially from the holidays.

– Friday appeared to be the busiest day of the week in terms of auto shopper traffic. It, however, had the third smallest ratio of forms-to-visits, which means there is room for improvement in terms of engagement and quality.

– Though Sunday was the slowest, the traffic that day had a higher tendency to view vehicle pages.

– The busiest hour of the day was 19:00 GMT, 14:00 EST, 11:00 PST, which might be information dealers can use to optimize ad planning.

So what do these numbers tell us?

For one thing, 2016’s shopper traffic data illustrates that while we do see some pretty distinct trends, it’s very difficult – and potentially risky – to paint digital shopping behavior with a broad brush. If Fridays, for example, were such reliably busy shopping days, why was a Sunday in the middle of summer the busiest?

Perhaps the most important information gleaned from 2016’s data is that high traffic quantity doesn’t always correlate to high quality traffic. In other words, high web traffic (quantity) means little if that traffic isn’t converting (quality).

This was the case in 2016, where Fridays were the busiest days though they were third from last in terms of conversions. This means there’s significant room for improvement for digital engagement. Dealers need to give consumers a reason to go beyond simple digital window shopping. They need to provide engaging, secure, and transparent online deal-making tools that meet today’s shoppers’ evolving expectations.

Digital shopping patterns will evolve over time, and 2017’s data may differ slightly or significantly. But attracting and converting high quality shoppers will remain a goal unchanged.

James Grace is the director of product management analytics at Dealer.com

3 Reasons to Drill Down into Your Web Data Using Referral Analytics

Whether you’re a seasoned dealership analytics veteran or just getting started in tracking your business’s digital performance, this article is for both of you. Think of digital traffic this way: it’s a binary stream of car shopper data that flows to your dealership. The head waters of this traffic are numerous: your dealership website, social media, Google reviews, online marketplaces, email campaigns. Almost everywhere potential shoppers go online, there are digital touch points to help steer them down a path to purchase a car from your dealership.

But even the most roaring river of shopper data would mean little if it weren’t trackable and measurable. Enter referral analytics.

Referral analytics are what tell your website host where traffic is coming from to reach your site. Common referral sources include Google, Facebook, and Autotrader, to name a few. Most websites accessed with a desktop or mobile browser will provide this referral information when a user clicks a link that takes him or her from one site to another.

Email campaigns, links in chat systems, and mobile phone apps require tracking codes to specify campaign source (i.e. “newsletter”), campaign name (i.e. “October”), and other parameters. For users of Google Analytics, you know these as UTM codes. Using these UTM codes would allow a website administrator to drill down into the data to see, for example, how many website visitors got to the website via the link placed in the October email newsletter or the tent sale post made on the store’s Facebook account.

But here’s why referral analytics are really important:

1. Monitoring your referral analytics helps you see which of your marketing channels are getting people to your website. If a particular channel, such as your mobile phone app, is not effectively driving web traffic to your site, you may need either to re-assess the user experience of the app or it may be time to consider ending that channel and reallocating those funds into one that’s producing better results.

2. Referral analytics also show you how well the traffic from each digital channel is performing on your site. Performance metrics such as “average time on site” and “page views per visit” can be assessed for each specific referral source, allowing you to see which sources are delivering high-performing (engaged) traffic instead of poor (low time on site, low page views per visit) traffic.

3. Ultimately, all of the information you can see for referral traffic can be used to strengthen your digital strategy. If you know that the traffic coming from your paid search ads is performing well, you know you need to continue investing the same amount of resources into that channel, if not more. Most often, when you’ve got a high-performing channel you want to increase the investment in that channel until you start to see diminishing returns.

Your dealership website is a high-quality chef’s knife. For best results, you’ve got to keep it sharp and clean. Neglect it and it becomes a blunt instrument, lacking the precision needed for carefully targeted cuts. Analytics are the knife sharpener, a tool to help transform your digital dealership from just another car dealer website into an intelligent, relevant, and engaging user experience – one that is more likely to increase the odds of a sale.

Jarod Sams is a senior Digital Advisor at Dealer.com